(630) 682-4700
2655 Warrenville Road, Suite 225, Downers Grove, IL 60515

Better information about your collection, water, and stormwater systems
Explore Clarity
Better information about your collection, water, and stormwater systems
Explore Clarity
This small Texas town cast a gigantic vision for creating an asset management program for its water and wastewater systems. RJN helped them achieve the program plan and establish an iterative process for infrastructure performance improvement.
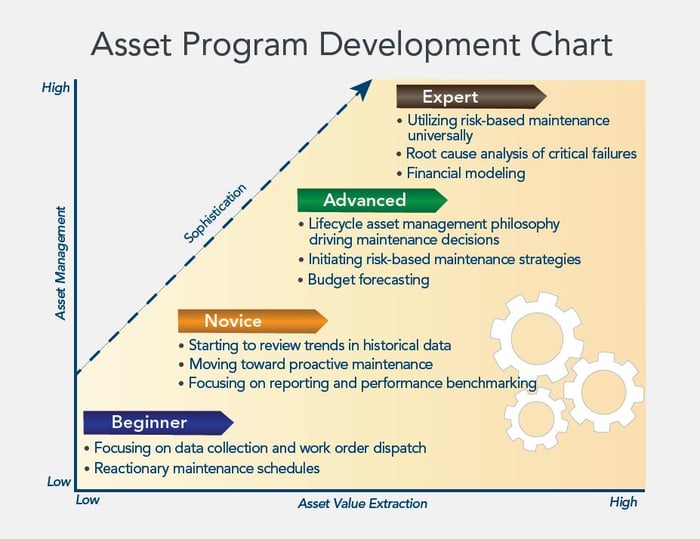
Asset management may seem like a daunting task, requiring a huge amount of effort and an enormous amount of money, but RJN originated a plan that was scalable enough to evolve with their water and wastewater utilities and serve as the City of Wilmer's step-by-step blueprint.
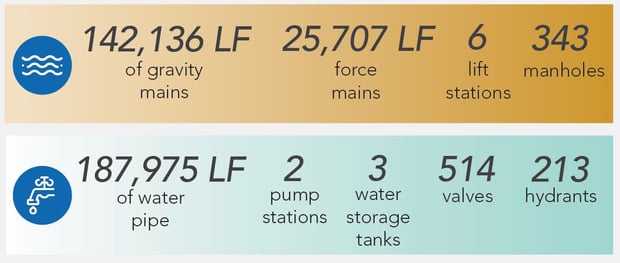
The population of Wilmer, Texas, has grown by 22% over the last decade, and the City has developed into a southwestern multimodal shipping hub. Clustered around the Union Pacific Terminal, Wilmer’s commercial and industrial businesses have boomed primarily due to its interstate-accessible location.
Working with RJN Group, Inc., the City implemented cost-effective methods to proactively manage its water and wastewater assets for the next decade by:
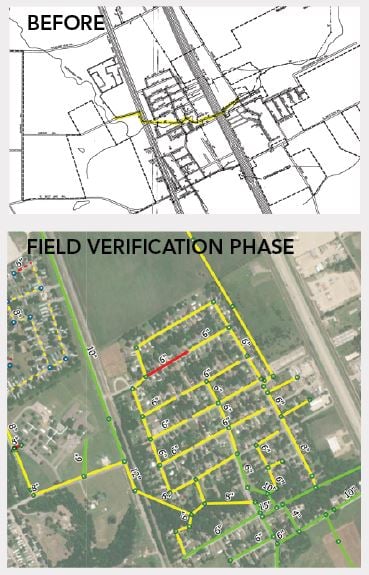
Asset data was separated into disparate sources, i.e., CADD files, condition logs, performance reports, as-built drawings, and technical memorandums. Our research revealed that the existing
data held insufficient, inconsistent, or inaccurate information. RJN conducted field verifications and staff interviews to:
The results were consolidated into a unified, interactive GIS solution serving as the foundation for long-term asset management.
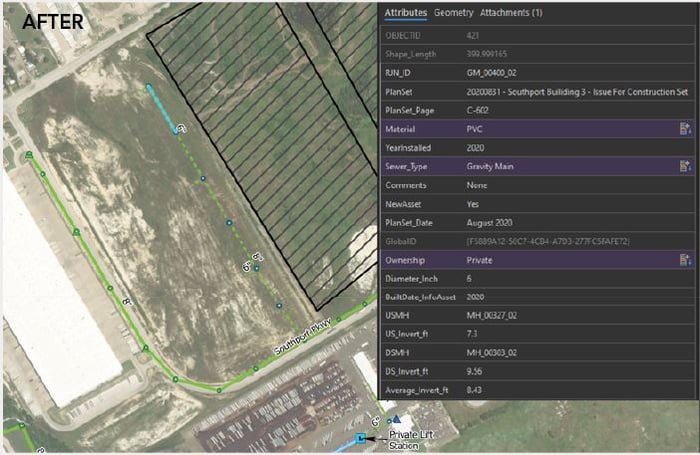
Asset attributes and as-built drawings were integrated so data is accessible via GIS.
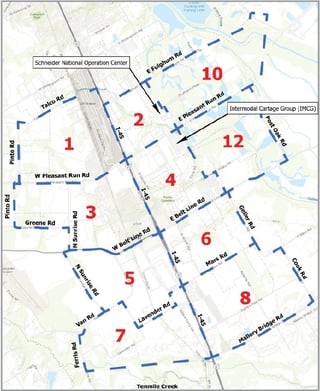
RJN worked with the City to develop a logical schema for asset identification by dividing the system into grids using major highways and roadways for easy memorization. Asset IDs are comprised of two letters defining the asset type, a sequential number, and the grid number in which that asset is located. For example, GM_00225_03 references the gravity main 00225 found in Grid 03.
This method conveys as much information as possible, allowing City staff to easily identify the type and location of assets without looking in the GIS. Additionally, relevant as-built documents were linked to asset IDs in the geodatabase.
RJN led workshops and discussions with City staff to identify strategic parameters for risk analysis and leverage the City’s institutional knowledge of its water systems, geographic relationships, and essential buildings. Items discussed included pipe materials, aging equipment, impaired structures, pressurized flow, and domino-like failure impacts on systems.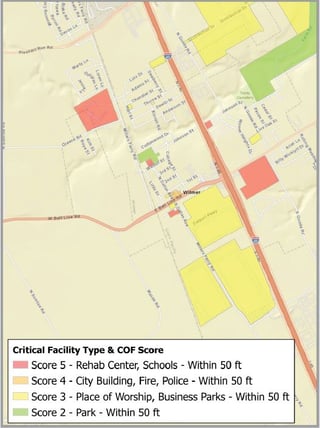
The consequence of failure (COF) depicts the total impacts on the community upon loss of services. Peak COF represents an asset’s importance to system operations. COF criteria included redundancy of services, water capacity, and proximity to:
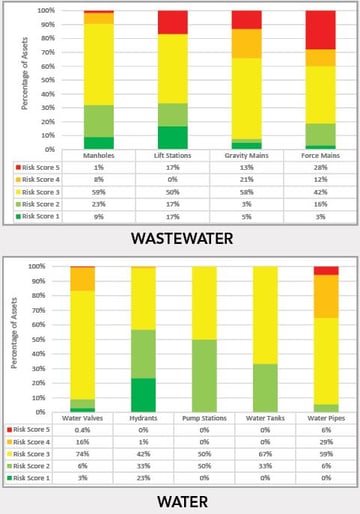
The likelihood of failure (LOF) applies a risk score based
on an asset’s potential for failure. Peak LOF represents an asset’s overall condition. COF and LOF scores are measured on a one to five severity scale.
Although inspection data is the preferred method to forecast LOF, it was not available at the outset. It was mutually agreed to use alternative information, such as age and asset material, as the starting point for LOF calculations. InfoAsset Planner™ software calculated the COF and LOF based on the selected parameters.

Software input algorithms required our engineers to identify weather-related contingencies and conditional relationships for existing infrastructure. Once parameters are entered, InfoAsset Planner™ calculates the threat level for when an asset or a series of assets might fail.
For example, there are two ways potable water enters the City. The main source is a 16-inch polyvinyl chloride (PVC) pipe, and the secondary is an eight-inch cast iron pipe. If the 16-inch line fails, it would be catastrophic for the community's water supply and prevent first responders from doing their emergency work. Thus, the pipeline has a higher risk score applied. In asset management, this pipe is called critical infrastructure. The calculated risk score for each asset guides the development of future inspections, ongoing maintenance planning, and capital investment.
Just because an asset is a high risk (marked in red), it does not mean that the asset is in imminent danger of failing. A high-risk score identifies the most threat to water or wastewater operations. A new asset with a high-risk score that is critical to maintaining services may not need immediate repair but should be inspected, maintained, and serviced more frequently.
A primary goal of the asset management program is to maintain a desired level of service for its customers through preventive maintenance and transform condition assessment data into action plans and capital improvements. To that end, inspection and maintenance plans were developed for each asset type.
Packaging field tasks in clusters is an ideal cost-effective approach. This method allows for more efficient field investigations and savings in terms of consolidated work locations and crew mobilization.
As condition data is captured over the next ten years, the dynamic risk scoring will make asset management adaptable as systems evolve.
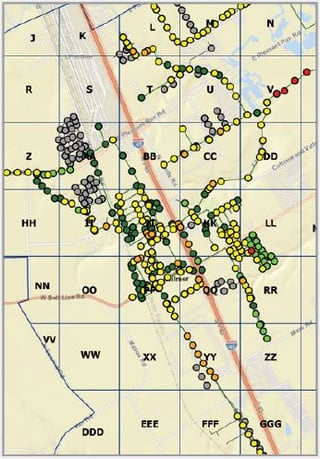
Grids with multiple high-risk assets were placed on top of the priority list for inspection.
Grid YY ranked higher than Grid V due to the clustered number of flagged assets.
Sanitary sewer inflow and infiltration (I/I) reduces capacity and increases treatment costs. The City pays per gallon to treat its wastewater, so reducing I/I will facilitate long-term pumping and treatment savings.
 RJN’s wastewater recommendations included:
The schedule of inspections was prioritized based on generated risk scores and Texas Commission on Environmental Quality (TCEQ) wastewater management standards. These inspection methods will inform I/I reduction strategies and significantly decrease system stress over the next decade.
Non-revenue water loss can significantly impact municipal budgets and lead to pipeline failure if not detected and repaired promptly. Routine investigation of water distribution systems is essential to ensure operators can effectively locate, access, and control water flow.
 RJN’s water distribution recommendations included:
The schedule of inspections was prioritized based on generated risk scores and TCEQ water quality inspection standards. Action plans for regular maintenance can reduce energy costs, prolong its remaining useful life, and improve overall hydraulic performance.